Monday, 04 December 2023
  2 Replies
  0.9K Visits
Check out this thought piece continuing the conversation started during the TechNet-21 conference in Panama at a side event: https://www.jsi.com/cold-chain-maintenance-done-differently/ How can we best translate this temperature data and insights into actions for different immunization supply chain stakeholders including cold chain technicians, finance and budget managers, facility managers, and supply chain managers. Share your thoughts and ideas!
4 months ago
·
#7152

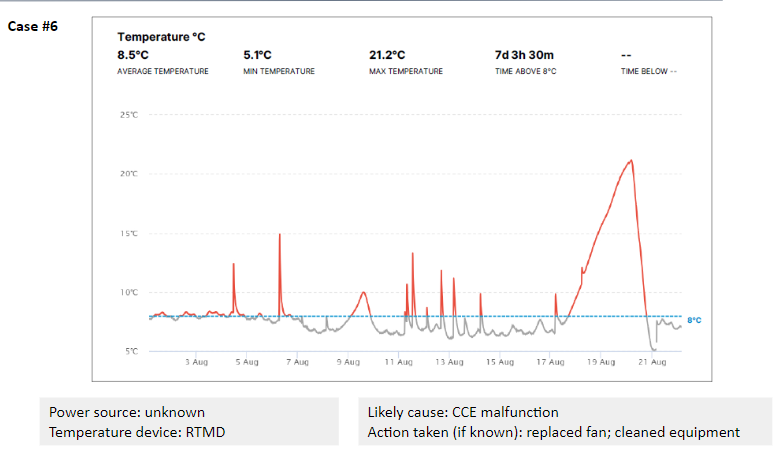
Thanks colleagues for helping to organize this session--it was very enlightening! Temperature is an invisible property--I think the charting of actual temperature data is a powerful tool for triggering a new understanding of what happens in a refrigerator. Are there country CCE managers out there who are using temperature charts as a regular tool for communication and problem solving? Would love to hear about your experience!

example_temp_chart.jpeg

4 months ago
·
#7154

Hi Joanie


Several years I unsuccessfully tried to promote using MKT temperature to see how a temperature excursion would affect  the life of a vaccine. Calculating the MKT temperature in combination with the Arrenhenius graphs you could find the percent of life lost for vaccines of differing sensitivities for the temperature profile in your example.  I don't think there is another way to quantitatively see the effect of an excursion on the life of a vaccine.

Since the the loss of life increases exponentialy at higher temperatures it is hard to  visually see the consequences of a temperature excursion by looking at a graph. There may be instances, for example where a system has a bad battery and each night the temperature would go above 10 Deg C. Using an MKT analysis you could find that the excursion has a negligible effect on the life of  a vaccine and fixing the battery could become a lower priority.

Larry Schlussler PhD

Sun Frost

My new email address   [email protected]

4 months ago
·
#7162

I think routinely (also) using MKT is a great idea. DHIS2 would like to develop a mobile app for connecting EMS (Equipment Monitoring System) compatible cold chain equipment to a mobile phone via Bluetooth and use the 10-minute readouts for (also) calculating the MKT in the mobile app and displaying it in analytics tools. A single value which can summarize hundreds or thousands of temperature values is a dream come true for analysts and every-day users which is quicker and easier to interpret than a long time series.

  • Page :
  • 1
There are no replies made for this post yet.