For 30DTR the data collection through downloads from the 30DTR devices might not be obvious for all supervisors, in particular if the training is done using one type of software and supervisors have different softwares installed on their laptops. The process of converting the format of the file downloaded into Excel for example depends upon the software installed/available. Trainers should take that into account and standardisation of the managers' laptops or tablets is advisable whenever possible.
Good archiving conventions are necessary to keep an overview of the documents, i.e. YYYY_MM_Facility name.
A SOP should document the conventions regarding the frequency of automated reports, the frequency of the data backups, how long the data should be archived.
Supervisors should be trained in data manipulation, in order to be able to merge files, use them for reporting.
EPI staff must be introduced to the GUI (Graphical User Interface) of the visualization tool. They should be walked through the possible graph patterns and how to interpret the findings, to be able to make a diagnosis of the situation based on the data. It is crucial to verify that the users are able to understand and use the data and to familiarize them with the scale and range of data introduces.
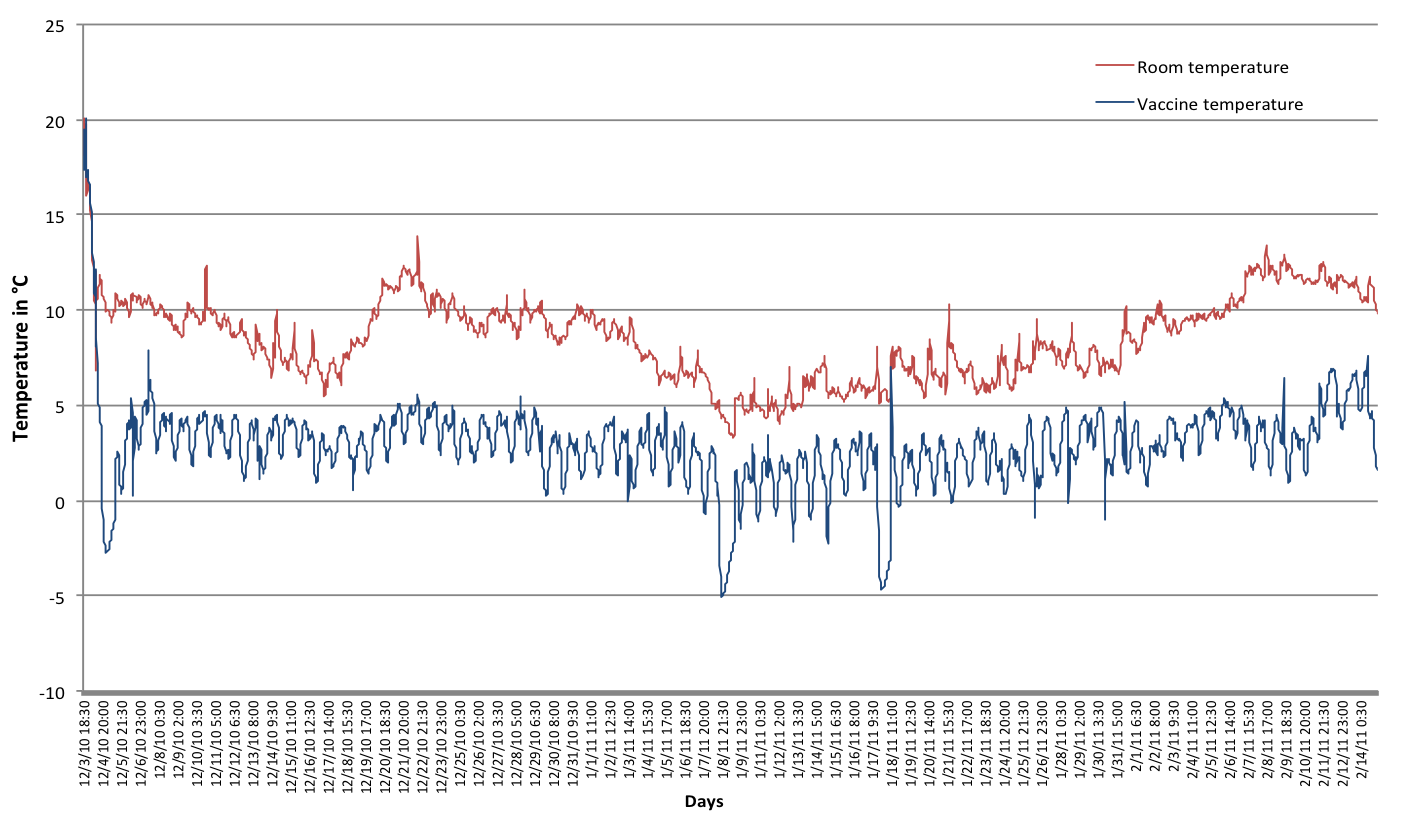
Source: Mongolia EPI vaccine Temperature study 2010-2011, Ranjit Dhiman
The graph above shows occurrence of freezing. It also show how temperatures fluctuate between night and day in a country with cold nights. As seen in the graph, most tools show ambient temperature as well as the temperature recorded in the vaccine storage. This information proves useful for remote diagnosis of the equipment.
The graphs below show 2 other examples of temperature patterns that can provide a clear diagnosis of the situation in the equipment.
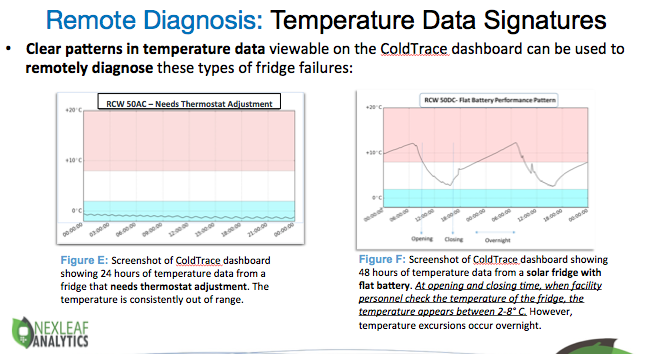
Source: ColdTrace, data visualisation
Management training, training in risk management approach to help managers prioritize preventive, detective and mitigation measures and make data-supported pro-active rather than reactive decisions
In conclusion, long-term sustainability and efficacy is determined by a good understanding of the system by users and access to supportive resources.
Related resources
Resources not available.
This video shows how to set up the date and time and temperature scale, how to read temperature and how to download data from the Fridgetag to a computer.
Guidance issued by UNICEF for the implementation of systematic temperature monitoring systems using 30DTR at Static Delivery Points (Health facilities).
Guidance issued by UNICEF presenting a few step-by-step guidelines for partners intending to implement RTM solutions.