Why monitor?
Data brings transparency: in order to assess and improve cold chain management, decision-makers need to know what is going on in the field through data collection and reporting.
Data drives action and improvement: in order to improve systems efficiency and effectiveness, data on temperature monitoring generated by the system must be used and must trigger action to address uncovered problems/issues and lead to measurable improved cold chain performance and better EVM scores.
What to monitor?
The analysis of temperature graphs for all pieces of cold chain equipment provides a wealth of information for the diagnosis of the equipment. However this requires collecting an extensive quantity of data that will take time and skills to analyse and this might not always be realistic for all equipment. It might only be possible at central, regional and district level.
For refrigerators, 2 digits representing the number of heat and freeze alarms during the past month are sufficient to yield a reasonable diagnosis of the status of cold chain equipment provided the cause of the alarms and the response to the alarms are monitored as well. Mapping of “failures to respond” and repeated alarms will provide a focus assessment of which areas need attention and fixing. Forms have been created to record alarms and their causes as per the example in the resources below. A repair log for all pieces of equipment should be maintained for all sites.
Indicators must be defined and used in order to measure progress against the baseline. The table on the right provides examples of possible indicators.
|
Measurable indicators from EVM and pilot temperature monitoring projects can be used for inspirations and can be tailored to country specific circumstances:
|
Indicators should be incremental. For example, if a maximum turnaround repair time of 2 weeks is the target and if the country does not have any system for the management of repairs it would be unrealistic to expect to achieve the 2 weeks right away. It could be 2 months for the first 6 months of the project, then 1 month for the following 6 months of the project and finally aiming for 2 weeks.
Validate and use temperature monitoring data
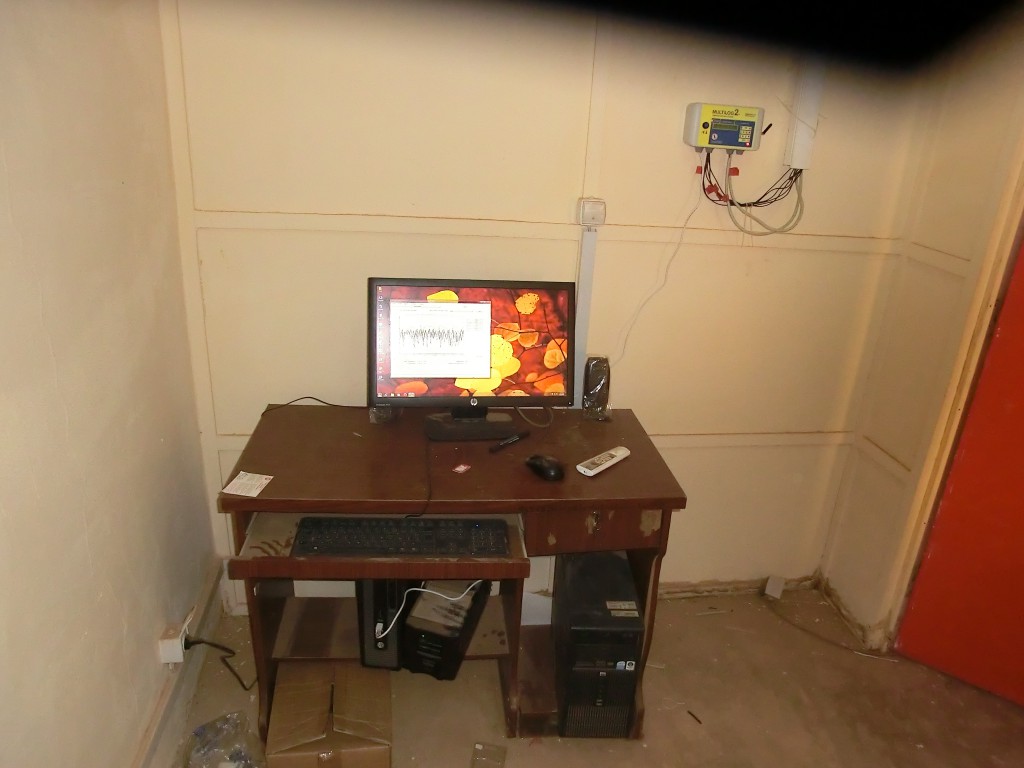
Source: Burkina Faso, multilog, Denis Karaga
Experience shows that if the data is not systematically collected and used, it might not always be reliable. 30 DTR readings shoulde validated at regular intervals.
It has happened that during a visit to a clinic, the temperature monitoring chart looked perfect with all the required measurements and all temperatures in the normal range. Yet after checking the 30DTR device in the equipment, alarms showed on the 30DTR device, that did not appear on the temperature monitoring sheet.
Many temperature studies show that increased focus on temperature monitoring data during the study leads to increased quality of the readings by health workers. Health workers need to know that the recording of the temperature reading is not a case of going through the motions because it is a WHO requirement but that the data will be used to improve their working conditions and the quality of the care they are able to give. Otherwise why bother if you are already really busy with care-giving tasks?
For RTM the biggest challenge is the sheer volumes of data automatically collected and the organisation of the data. The recent temperature study made by VillageReach and Nexleaf in Mozambique (piloting the use of RTM at health facility level) shows that even though RTM provides on-line continuous monitoring, receiving one monthly report for each storage unit was the preferred solution for on-going monitoring, apart from the alarming feature because it is simple. When they receive the report in their mailbox, it acts as a reminder that they need to look at the temperature monitoring data.
Some RTM systems come with software to organize data whereas others require the data to be organised by the users. Temperature data should be kept for approximately 2 years, the last 6 months being the most important.
Evaluate
After the first initial period, and regularly thereafter, performance and progress should be tracked. An objective evaluation of the project can help readjusting. For phasing deployment, evaluations should take place before expanding to the next phase of the implementation plan. It includes the following:
- Rate of adoption of new processes
- Rate of compliance with SOPs
- Root-cause analysis for under-achieved objectives
- Appropriateness and quality of technical support
- Success of training
- Budget deviations
Keeping track of the indicators can be done through the temperature monitoring data collected and through the system data, assessed by managers and supervisors and possibly independent assessors.
Related resources
Resources not available.
Sample of a temperature monitoring chart in English for use with temperature recorders. This format includes space for recording the alarms.
Sample of a temperature monitoring chart in French for use with temperature recorders. This format includes space for recording the alarms.
Link: http://www.technet-21.org/library/2555-temperature-monitoring-sheet-french
Sample of an alternative temperature monitoring chart in French for use with temperature recorders. This format includes space for recording the alarms.
Link: http://www.technet-21.org/library/2557-temperature-monitoring-sheet-graph-type-french